
NTMWD is committed to meeting the high standard of fiscal transparency by providing its Member Cities and Customers with user-friendly information showing how revenues are budgeted and spent.
This financial transparency page contains information required by the Texas Comptroller of Public Accounts to qualify the Comptroller’s Transparency Stars Program. NTMWD has provided additional financial information not required by the Comptroller’s program. This information will provide a broader understanding of NTMWD’s finances.
Financial Summary - FY2024*
| Net Operating Revenue Budget | $ 747,428,620 |
| Net Operating Expense Budget | $ 743,392,815 |
| Total/Per Capita Property Taxes | $ – |
| Total/Per Capita Sales Taxes | $ – |
*Fiscal Year is October 1 to September 30.
-
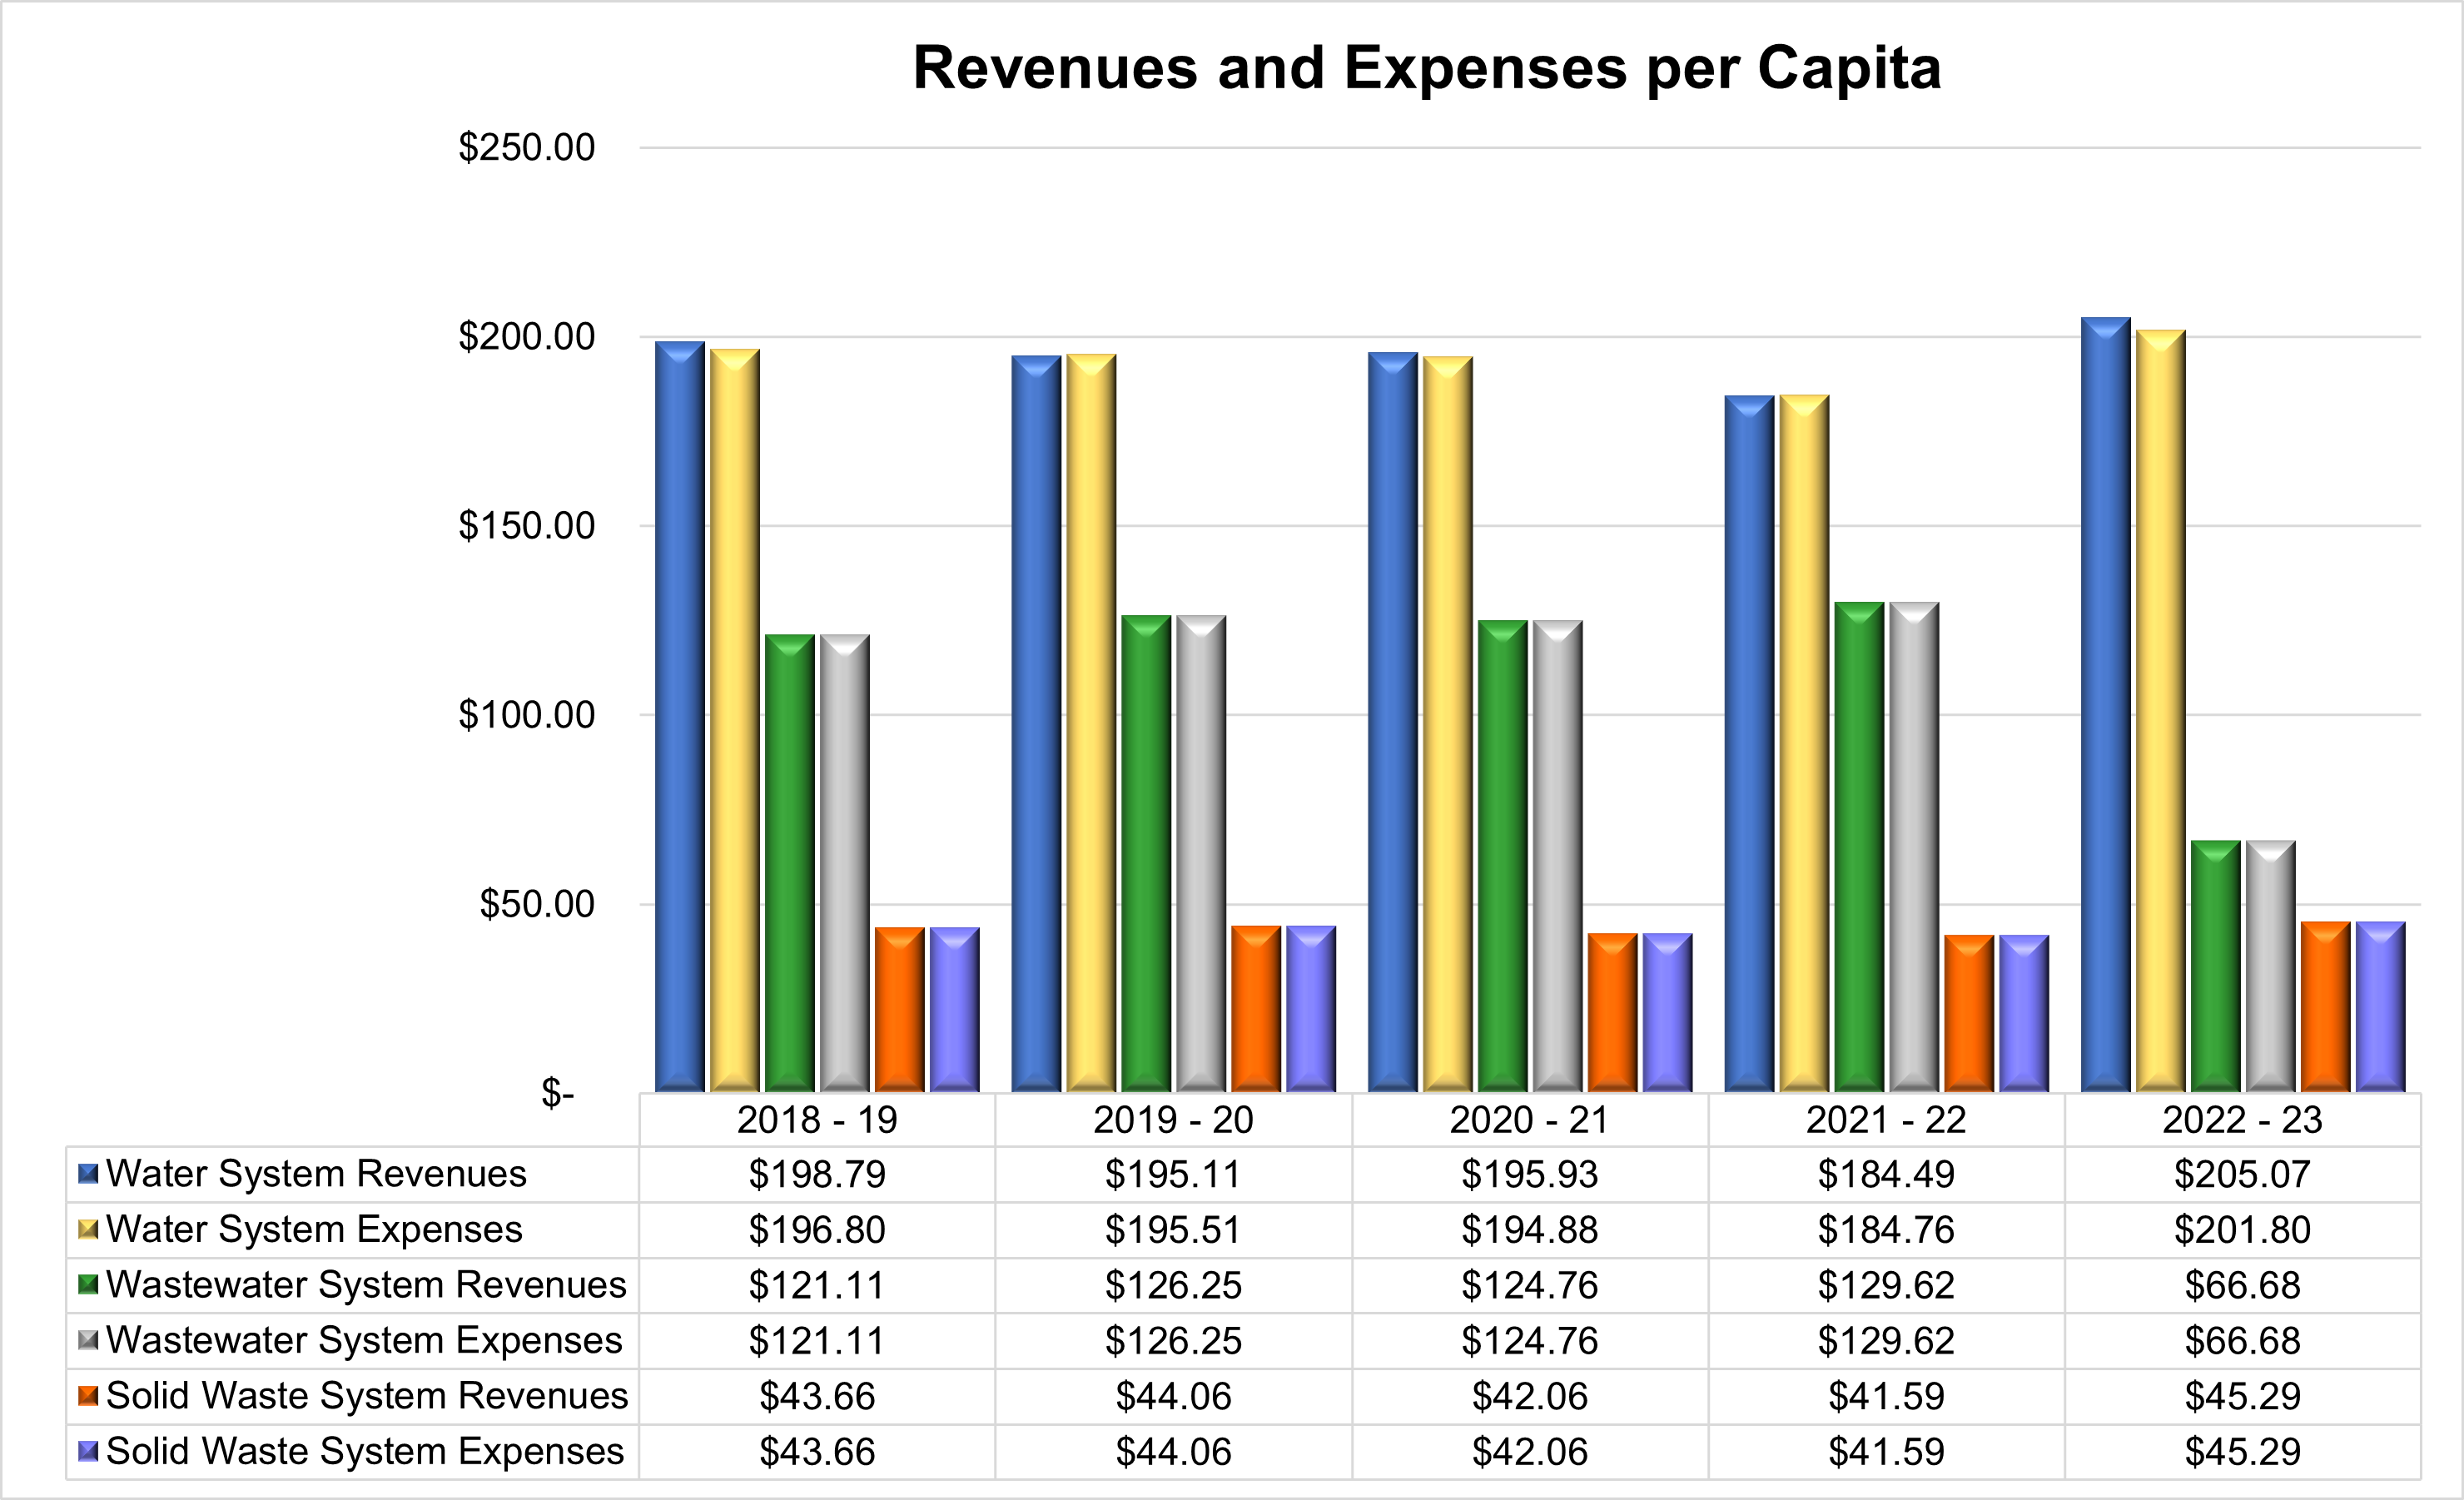
Revenues and Expenses per Capita (click to expand)
Regional Water System (RWS) Revenues and Expenses per Capita
2019-20 2020-21 2021-22 2022-23 2023-24 Population Served 1,824,000 1,875,000 2,000,000 2,100,000 2,200,000 Revenues $355,877,850 367,370,410 368,972,505 430,650,970 473,423,880 Revenues per Capita $198.79 195.11 195.93 184.49 205.07 Expenses $356,614,720 365,403,610 369,517,555 423,788,850 469,388,075 Expenses per Capita $195.51 194.88 184.76 201.80 213.36 Wastewater System (WW) Revenues and Expenses per Capita
2019-20 2020-21 2021-22 2022-23 2023-24 Population Served 1,248,000 1,333,000 1,400,000 1,460,000 1,530,000 Revenues $157,559,455 166,307,915 181,474,385 203,713,480 228,456,010 Revenues per Capita $126.25 124.76 129.62 139.53 149.32 Expenses $157,559,455 166,307,915 181,474,385 203,713,480 228,456,010 Expenses per Capita $126.25 124.76 129.62 139.53 149.32 Regional Solid Waste System (RSWS) Revenues and Expenses per Capita
2019-20 2020-21 2021-22 2022-23 2023-24 Population Served 869,000 914,000 930,000 960,000 966,000 Revenues $38,289,625 38,444,515 38,677,405 43,473,935 45,548,730 Revenues per Capita $44.06 42.06 41.59 45.29 47.15 Expenses $38,289,625 38,444,515 38,677,405 43,473,935 45,548,730 Expenses per Capita $44.06 42.06 41.59 45.29 47.15 Note: Population estimates are from North Central Texas Council of Governments


-
System Staffing History (FTE) (click to expand)

District-wide Staffing FY20 FY21 FY22 FY23 FY24 Regional Water System 127 127 136 146 153 Regional Wastewater System 137 140 142 160 165 Upper East Fork Interceptor System 22 22 23 23 24 Sewer System 75 74 77 76 75 Regional Solid Waste System 113 114 113 116 116 Shared Services 380 399 398 406 422 Total Employees 873 875 897 943 969
Annual Budget
| Fiscal Year 2023-2024 | EXCEL (raw) | Budget in Brief | |
| Fiscal Year 2022-2023 | EXCEL (raw) | Budget in Brief | |
| Fiscal Year 2021-2022 | EXCEL (raw) | Budget in Brief | |
| Fiscal Year 2020-2021 | EXCEL (raw) | Budget in Brief | |
| Fiscal Year 2019-2020 | EXCEL (raw) | ||
| Fiscal Year 2018-2019 | EXCEL (raw) | ||
| Fiscal Year 2017-2018 | EXCEL (raw) | ||
| Fiscal Year 2016-2017 | EXCEL (raw) | ||
| Fiscal Year 2015-2016 | EXCEL (raw) |
Annual Comprehensive Financial Reports
| Fiscal Year 2022-2023 | Fiscal Year 2021-2022 |
| Fiscal Year 2020-2021 | |
| Fiscal Year 2019-2020 | |
| Fiscal Year 2018-2019 | |
| Fiscal Year 2017-2018 | |
| Fiscal Year 2016-2017 | |
| Fiscal Year 2015-2016 | |
| Fiscal Year 2014-2015 |
Single Audit Reports
Financial Quarterly Reports
Monthly Financials
| December 2023 | |
| November 2023 | |
| October 2023 | |
| September 2023 | |
| August 2023 | |
| July 2023 | |
| June 2023 | |
| May 2023 | |
| April 2023 | |
| March 2023 | |
| February 2023 | |
| January 2023 | |
| December 2022 | |
| November 2022 | |
| October 2022 |
Current Fiscal Year 2023-2024 Monthly Check Registers
Prior Fiscal Year Check Registers
| Fiscal Year 2022-2023 | EXCEL | |
| Fiscal Year 2021-2022 | EXCEL | |
| Fiscal Year 2020-2021 | EXCEL | |
| Fiscal Year 2019-2020 | EXCEL | |
| Fiscal Year 2018-2019 | EXCEL | |
| Fiscal Year 2017-2018 | EXCEL | |
| Fiscal Year 2016-2017 | EXCEL |
Strategic Financial Plans
The following are 1-2 page summaries representing the long term forecast, for Member Costs, Total Costs and Expected Flows / Tonnage, for each of the District’s Operating Systems. Each summary compares the current forecast with the prior year’s forecast along with key drivers.
Water
-
View Documents
2024 Water – Kaufman Four-One Water Transmission Facilities
2024 Water – Plano Water Transmission Facilities
2024 Water – Regional Water System (Customer)
2024 Water – Regional Water System (Member)
2024 Water – Rockwall Water Pump Station Facilities
2024 Water – Rockwall-Heath Water Storage Facilities
2024 Water – Terrell Transmission Facilities
Wastewater
-
View Documents
2024 Interceptor – Buffalo Creek
2024 Interceptor – Forney
2024 Interceptor – Lower East Fork
2024 Interceptor – McKinney
2024 Interceptor – Muddy Creek
2024 Interceptor – Mustang Creek
2024 Interceptor – Parker Creek Parallel
2024 Interceptor – Parker Creek
2024 Interceptor – Sabine Creek
2024 Interceptor – Upper East Fork
2024 Wastewater – Buffalo Creek Wastewater Treatment Plant
2024 Wastewater – Farmersville Wastewater Treatment Plant
2024 Wastewater – Lavon Wastewater Treatment Plant
2024 Wastewater – Muddy Creek Wastewater Treatment Plant
2024 Wastewater – Panther Creek Wastewater Treatment Plant
2024 Wastewater – Pretreatment Program
2024 Wastewater – Regional System
2024 Wastewater – Sabine Creek Wastewater Treatment Plant
2024 Wastewater – Seis Lagos Wastewater Treatment Plant
2024 Wastewater – Stewart Creek Treatment Plant
Solid Waste
Open Records
The Texas Public Information Act gives the public the right to request access to government information. The request must ask for records or information already in existence. Visit our Open Records page to complete and submit a request for records.
Related Pages

Rates
